| NAME |
|
PARTNER'S NAME
EXPERIMENT 4.1
Equipment:
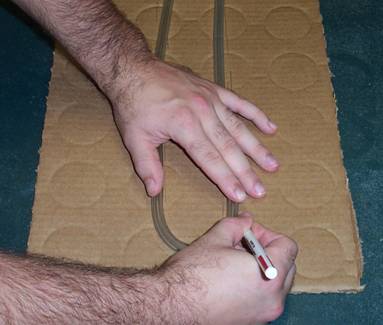
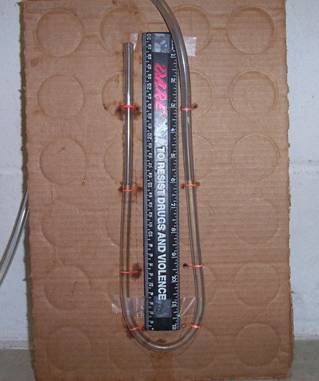
A manometer is a device that measures air pressure. This experiment explains how to construct a simple manometer. Begin by making a U-shape with the end of the tube about 3" [7.6 cm] wide so that the bend of the U is about 10" [25.4 cm] from one end of the tube.
Lay the U-shaped part of the tube against the cardboard and trace around both edges of the tube onto the cardboard.
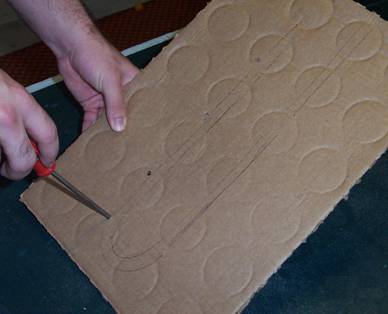
Poke holes through the cardboard on either side of the tube in various places. Attach the tube to the cardboard by threading string through the holes and around the tube, then tying the string on the backside of the cardboard.
Tape the ruler to the cardboard so that it lies in the middle of the U-shaped section of tubing. Fill the tube with water so that the water level rises about 5 in [12.7 cm] on either side of the tube to complete the manometer.
Blow on the long end of the tubing and notice how the water levels change. From the change in water height, we can determine the pressure at the end of the tube. A high pressure will exert a larger force on the water. The water level on the opposite side of the U rises in order to balance the greater pressure acting on the other side. In fact, the water will rise so that the weight of the extra water on one side will be equal to the extra force due to increased pressure on the other side. The following example will demonstrate how the water height and pressure difference are related.
Example: Solution: Area = The volume is the cross-sectional area times the height, or 0.049 in2 times 1 in. This gives a volume of 0.049 in3 [0.803 cm3]. The weight of this volume of water is found using the density of water, which is 0.0361 lb/in3 [0.0098 N/cm3]. Weight = Density • Volume Remember that pressure is force divided by area, and the area has already been calculated to be 0.049 in2 [0.316 cm2]. Pressure = Force / Area It takes 5.2 lb/ft2 [249 Pa] of pressure to cause a water height difference
of 1 in [2.54 cm]. In fact, 5.2 lb/ft2 of pressure in the lift air cushion
of a hovercraft will cause the water under the hovercraft to be depressed
one inch. |
With this conversion factor, it is now easy to measure the pressure at the end of the tube. Simply measure the water level difference in inches, then multiply by 5.2 to find out how many pounds per square foot of pressure there is at the end of the long tube.
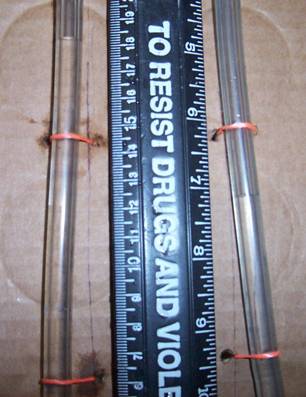
Look at the difference in water height between the two sides of the tube in the picture. The surface on the right side comes to about 7 1/8 in. The left side’s surface is at about 4 3/4 in. Subtracting these two heights gives a water level difference of 2 3/8 in, or 2.375 in. Multiplying this height difference by 5.2 gives the pressure in lb/ft2.
(2.375 in) (5.2 lb/ft2 per in) = 12.4 lb/ft2
The picture shows a pressure of roughly 12.4 lb/ft2.
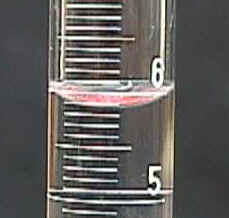
When measuring the height of the water, notice that the water level is curved.
Cohesive forces cause the water to try to stick to the sides of the tube, similar
to how drops of water will stick to the bottom of an icicle or the sides of
a cold drink, even though gravity is pulling the water down. This concave curve
of the surface, shown in the picture, is called a meniscus.
Since this adds some thickness to the surface of the water, it can lead to inaccurate
measurements if you aren’t careful. Make sure when reading the water level
that you always measure at the bottom of the meniscus. For example, in the picture
the water level looks like it’s at around 6 mL. Going off the bottom of
the meniscus, however, gives a measurement of 5.9 mL.
Another method to improve the accuracy of your measurement is to try to get
the tubes as close to the ruler as possible. This reduces something often called
parallax error. This is a measurement error that
occurs when the object you’re measuring is too far away from the measuring
device. When measuring the length of a string with a ruler, would you hold the
ruler 3 ft away from the string and try to measure it, or would you get the
ruler right next to the string? Naturally, the closer the ruler is to the string,
the easier and more accurate the measurement will be. In addition to keeping
the tubes as close to the ruler as possible, making sure that you’re eye
level with the water surface when measuring its height will also make your measurement
more accurate.
Measurement uncertainty is present in every measurement,
no matter what’s being measured or who’s making the measurement.
Although it can never be completely eliminated, a good measurement taker will
not only reduce the uncertainty as much as possible, but also know how to deal
with the uncertainty that can not be eliminated. As an example imagine trying
to measure the height of the water in one of the tubes. It looks like the surface
is at about 5 ¼ in on the ruler, but it’s hard to tell exactly
and could be anywhere between 5 in and 5 ½ in. You would write this measurement
as 5 ¼ in +/- ¼ in. This says that you think the measurement is
5 ¼ in, but you could be ¼ in too high or too low. This uncertainty
must now be included in any calculation done using this measurement. When calculating
the pressure, be sure to include how the uncertainty in the height will lead
to an uncertainty in the pressure.
( ¼ in ) (5.2 lb/ft2 per in) = 1.3 lb/ft2
Since the height measurement could have been ¼ in too high or too low,
the calculated pressure could therefore be 1.3 lb/ft2 too high or too low. When
you calculated the pressure, you would have to include +/- 1.3 lb/ft2 when you
write the result. Always include the uncertainty in any measurement you take
so everyone will know just how accurate your results are.
Try tilting the cardboard so that the manometer is leaning at an angle. Notice
that when the manometer is at an angle, it takes less pressure to raise the
water level. The relationship between the angle the sensitivity of the manometer
follows a sine function. When the manometer is sitting
straight up, one inch of water corresponds to 5.2 lb/ft2. If the
manometer is leaning at an angle the relationship changes to the following:
1 in [2.54 cm] ![]() 5.2 lb/ft2 sin(θ)
5.2 lb/ft2 sin(θ)
where θ is the angle between the manometer and the floor. This gives an advantage when trying to measure very small changes in pressure. For example, imagine the manometer is sitting at a 30° angle. Since sin(30°) is ½, one inch of water now corresponds to 2.6 lb/ft2 of pressure instead of 5.2 lb/ft2. Small pressures would now be easier to measure because they raise the water twice as much. The following section gives a detailed, though somewhat complicated, explanation of why the sine function is used.
To understand what’s happening, the gravitational force must be thought of as a vector. A vector is an arrow that is used to describe how forces act. The arrow points in the direction the force acts, while the length of the arrow describes the magnitude of the force, or how strong the force is. When the manometer is sitting straight up, gravity is acting straight down along the tube. When the air pressure pushes the water up, it’s acting in the opposite direction of gravity, and so must exert a force greater than gravity in order to push the water up. When the manometer is leaning at an angle, gravity is no longer acting only along the direction of the tube. It is now acting partly along the direction of the tube and partly into the cardboard. These two parts are perpendicular to each other. If two things are perpendicular ( _|_ ), they are aligned at a 90° angle to each other. If they are parallel ( || ), they are aligned in the same direction. The weight force can be broken down into two perpendicular components: a component acting along the tube (F||), and a component acting into the board (F_|_). Adding the two components together gives the weight force, called the resultant. Notice in the figure how the two components are added together.
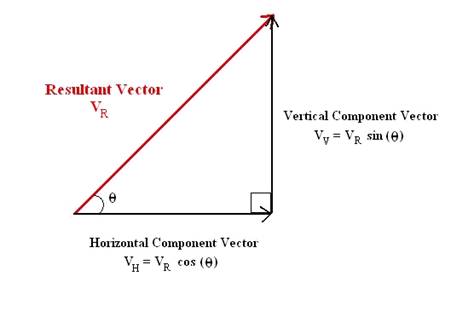
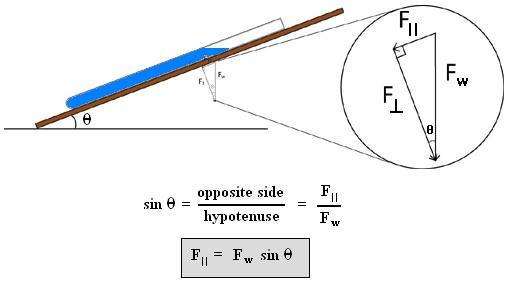
Now look at the figure of the manometer at an angle to see how the weight vector is broken down into components. The force that the pressure in the tube must overcome is the component of the weight that points along the direction of the tube. Notice that these three vectors form a right angle triangle. The component along the tube is equal to the hypotenuse of the right angle triangle times the sine of the angle. This component force is smaller than the actual weight of the water, so the air pressure has a smaller force to overcome when the manometer is leaning at an angle.
* NOTE:
To make a more durable and more accurate manometer (but more expensive), replace
the cardboard with a wooden board and use plastic staples to fasten the tube
to the board. Anti-freeze (Ethylene glycol) could also be used instead of water
in the manometer. Although toxic if ingested, this liquid doesn’t evaporate
like water, allowing your manometer to require less maintenance. Since the density
of ethylene glycol is different than water, you would have to use a conversion
factor of 5.8 lb/ft3 per inch of liquid instead of 5.2 lb/ft3.
EXPERIMENT 4.2
Equipment:
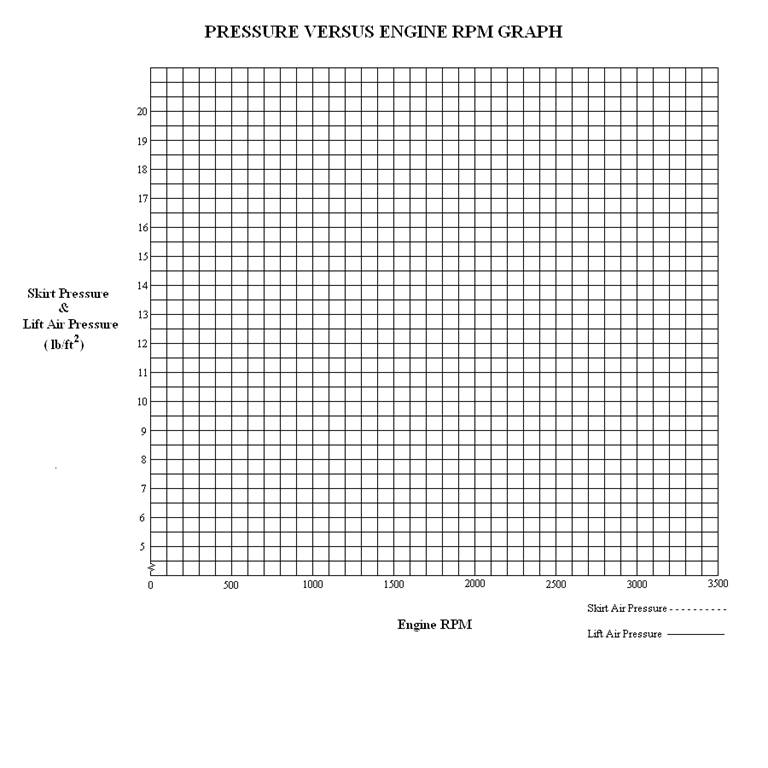
In this lab, we test the air pressure inside a hovercraft skirt and lift air pressure under the hull at different RPM’s. This will require using the manometer from Experiment 4.1 to take readings from both areas at pre-determined RPM levels. Use the data table provided to record your data and then graph the data.
1: Move the hovercraft outside (NEVER OPERATE A HOVERCRAFT INDOORS WITHOUT PROPER
VENTILATION). One person should record the data, one should hold and read the
manometer, one should operate the throttle and one should hold the craft, keeping
it from moving around. Remember that the craft will be on a cushion of air and
will move easily!
2: Start the engine and allow it to warm up for a minute or two, then place one end of the manometer under the hovercraft. If the manometer tube is not long enough to reach under the hovercraft, attach it to a longer tube. Be sure the tube DOES NOT blow out from under the craft! Tying a weight to it or taping it to the floor will help hold it steady. Let the engine idle and measure the RPM of the engine then read and record the pressure difference on the manometer. This will be called lift pressure. Repeat this procedure at settings of 1000, 1500, 2000, 2500, 3000, and 3500 RPM. NOTE: The engine fan may slow the engine enough that you may not be able to reach 3500 RPM. If this happens, record the highest RPM you can. Be sure to include the uncertainty in the pressure measurements.
3: After recording the data, return the engine to idle speed and place the flexible manometer tube into one of the two drain holes located in the rear of the skirt. Secure the tube with a piece of duct tape, then repeat the engine RPM settings and take readings just as you did in step #2. This will be known as skirt bag pressure.
4: When you have finished gathering data, return the hovercraft indoors. Confirm everyone has similar data in their tables.
5: Use the data to draw two graphs showing the pressure increase of both lift and skirt air pressure depending on the RPM of the engine. When graphing two different lines, be sure to use either different colored pens or use a solid line for one and a dashed line for the other. Skirt bag pressure should always be greater that lift air pressure.
6: For each RPM, find the skirt bag to cushion pressure ratio by dividing the
skirt bag pressure by the cushion pressure. This ratio should always be greater
than one since the skirt bag pressure should always be greater than the cushion
pressure. Graph the pressure ratio for each RPM.
DATA TABLE FOR RECORDING PRESSURE VALUES |
Engine RPM |
Skirt Bag Pressure |
Lift Air Pressure |
Pressure Ratio |
500 |
|||
1000 |
|||
1500 |
|||
2000 |
|||
2500 |
|||
3000 |
|||
3500 |